Oscar screenplays — spotting a winner was easier than naming the decade.
A text-mining project over 359 subtitle files — every Academy Award Best Original Screenplay nominee from 1940 to 2022. We expected the decades to separate cleanly and the winners to blur together. It was the other way around.
For Text Mining History and Literature, Casey Kaufman and I went looking for a number that "good screenwriting" might leave behind. The Academy Award for Best Original Screenplay seemed like the cleanest place to look — it honors writing specifically, it has run since 1940, and every year offers five nominees and exactly one winner. So we took all of them. Every nominee from 1940 to 2022, pulled from the Wikipedia list, with the win or loss attached to each.
The catch is that full movie scripts almost never get published. What you can find are subtitles, so subtitles became the corpus — 359 .srt files of dialogue and narration, with all the stage direction and cinematography that a script would carry quietly missing. That limit shaped everything we could honestly conclude.
Most of the project was cleaning subtitle files.
Subtitle filenames are a small disaster — release groups, resolutions, years, and codecs all jammed together — so a real chunk of the work was regex to recover the actual movie title, then fuzzy-matching those titles against the hand-built spreadsheet of winners to attach each film's win/loss label, then stripping out the timestamps so only language remained.
Before any modeling, one measurement set the tone. Average cosine similarity between scripts was 0.67 with stop words left in — unsurprising, since all dialogue leans on the same connective tissue — but only 0.17 once they were removed. That gap was an early warning: strip away the filler and these scripts are far more different than they look, which makes them hard to sort into neat groups.
The harder-sounding question was the answerable one.
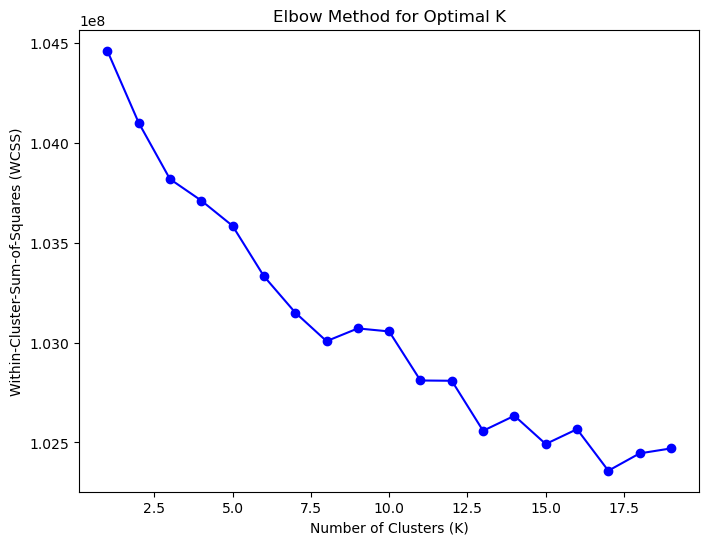
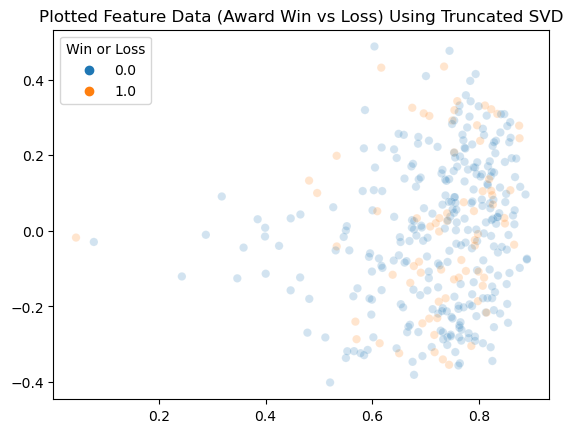
We went in expecting the decades to separate clearly — surely a 1947 script and a 2019 script read differently — and expecting winners and losers to blur together. The unsupervised pass agreed with the second half and not the first: K-means never produced a clean elbow, and a truncated-SVD view laid winners and losers right on top of each other. No obvious structure either way.
Supervised classification flipped it. A Random Forest on 200-token chunks, with stop words removed, separated winners from losers more reliably than logistic regression — which mostly retreated to predicting "loser," the safe call when four of every five nominees lose. Decade classification, the task we'd assumed was easy, came out weaker; the decades with the most films were the only ones the model handled well, which says the limit was data, not language.
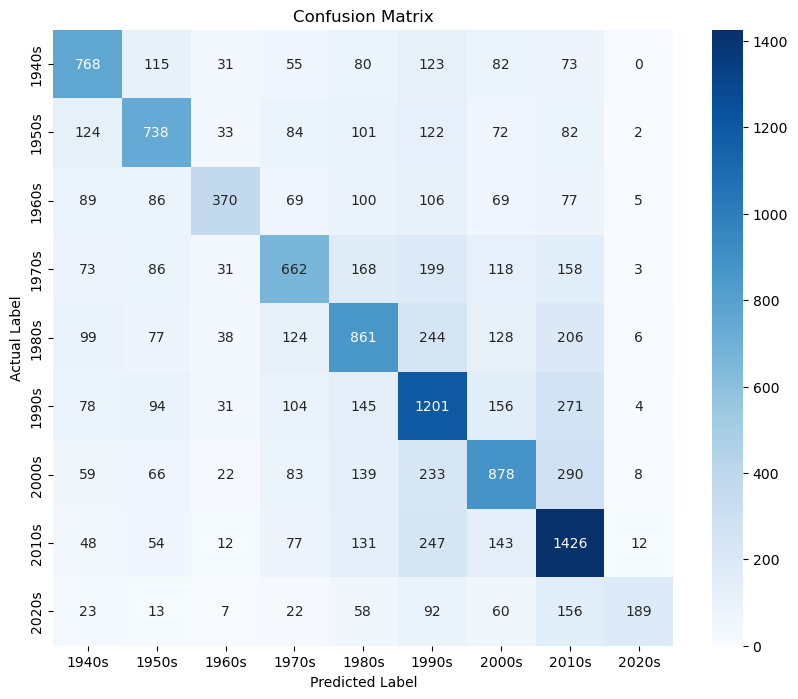
We assumed eighty years would separate cleanly and the trophy wouldn't. The model read it exactly backwards.
Two findings pointed the same way: context beats isolated words. The 200-token chunks beat single-token features, and removing stop words helped — both signs that what carries meaning is words sitting next to other words, not words counted alone.
The limits of subtitles, and of compute.
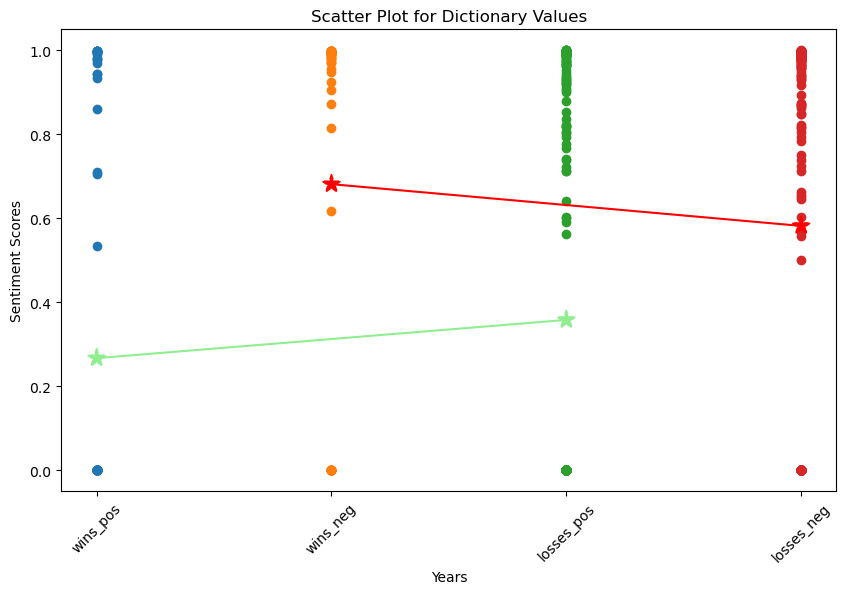
The honest ledger. The BERT decade classifier was estimated at roughly nineteen hours to train on what we had, so it simply never finished — a compute wall, not a result. And the sentiment analysis, run two ways with VADER and DistilBERT, showed almost no difference between winners and losers. Our read is that a sentiment model reads the plot — a war film is grim whether or not it won — and not the craft of the writing, which is the thing the award actually rewards.
There was one quiet finding hiding in the feature lists: the top words barely changed across eight decades. The likeliest explanation is that movies are written about the era they depict, not the era they were made in — a 1970s film set in the 1870s speaks 1870s. The corpus dates the setting, not the screenplay. Which is a fitting note to end on, because the whole project kept running into the same wall: subtitles can tell you what a movie is about far more easily than how well it was written.