The 2008 crisis — watching a bank's beta stop being diversifiable.
A risk-modeling project replicating Chaudhury (2014): rolling-window CAPM in R for Goldman Sachs and JP Morgan across 2006–2010. JP Morgan's beta climbed from 1.29 to 1.85 through the worst of it — and the real-estate funds we added on a hunch moved even more.
A stock's beta — how tightly it moves with the market — is usually quoted as if it were a fixed property of the company, like a ticker or a headquarters. It isn't. It drifts, and the place it drifts most violently is a crisis. For STSCI 5610, Data Science in Risk Modeling, three of us — Elana Pocress, Tiffany Filawo, and I — set out to watch that drift happen, by re-estimating beta in moving windows across the 2008 financial crisis and replicating Chaudhury's 2014 paper, How Did the Financial Crisis Affect Daily Stock Returns?
One regression, three windows.
The engine is the plainest model in finance: the CAPM market regression, daily excess return = alpha + beta × daily excess S&P 500 return. We pulled daily prices in R with quantmod — the S&P 500 as the market, the three-month Treasury from FRED as the risk-free rate — from January 2006 through December 2010, and computed daily returns over the index.
The whole trick is the windowing. We split the five years into three regimes — pre-crisis (2006), during (January 2007 through June 2009), and after (July 2009 onward) — and fit the same regression inside each one. The same stock, the same model, three different worlds. Beta is just the slope, and the slope is what we watched.
JP Morgan became the market; Goldman, oddly, calmed down.
JP Morgan's beta went 1.29 → 1.85 → 1.43. During the crisis its shares moved 1.85% for every 1% of the index, at an R² near 0.59 with a t-statistic around 30 — its company-specific story had been almost entirely swallowed by the market's. The bank stopped being a bet on JP Morgan and became a bet on everything, all at once.
Goldman Sachs did the opposite, and that was the interesting wrinkle: 1.72 → 1.53 → 1.05, falling through the crisis rather than spiking. Chaudhury's paper had Goldman's early-crisis beta rising, though not significantly — so our divergence sits inside the paper's own margin of doubt rather than contradicting it outright. Aggregated across his 31 stocks, the average beta still climbed from 1.30 to 1.72 before easing to 1.61, and the financial names' alpha swung from −0.07 to +0.21 over the same span: battered first, rewarded later.
The price paths underneath those betas carry the same crisis in a different register — indexed to 100 at the start of 2006, both banks ran with or above the market, then cratered through it into early 2009:
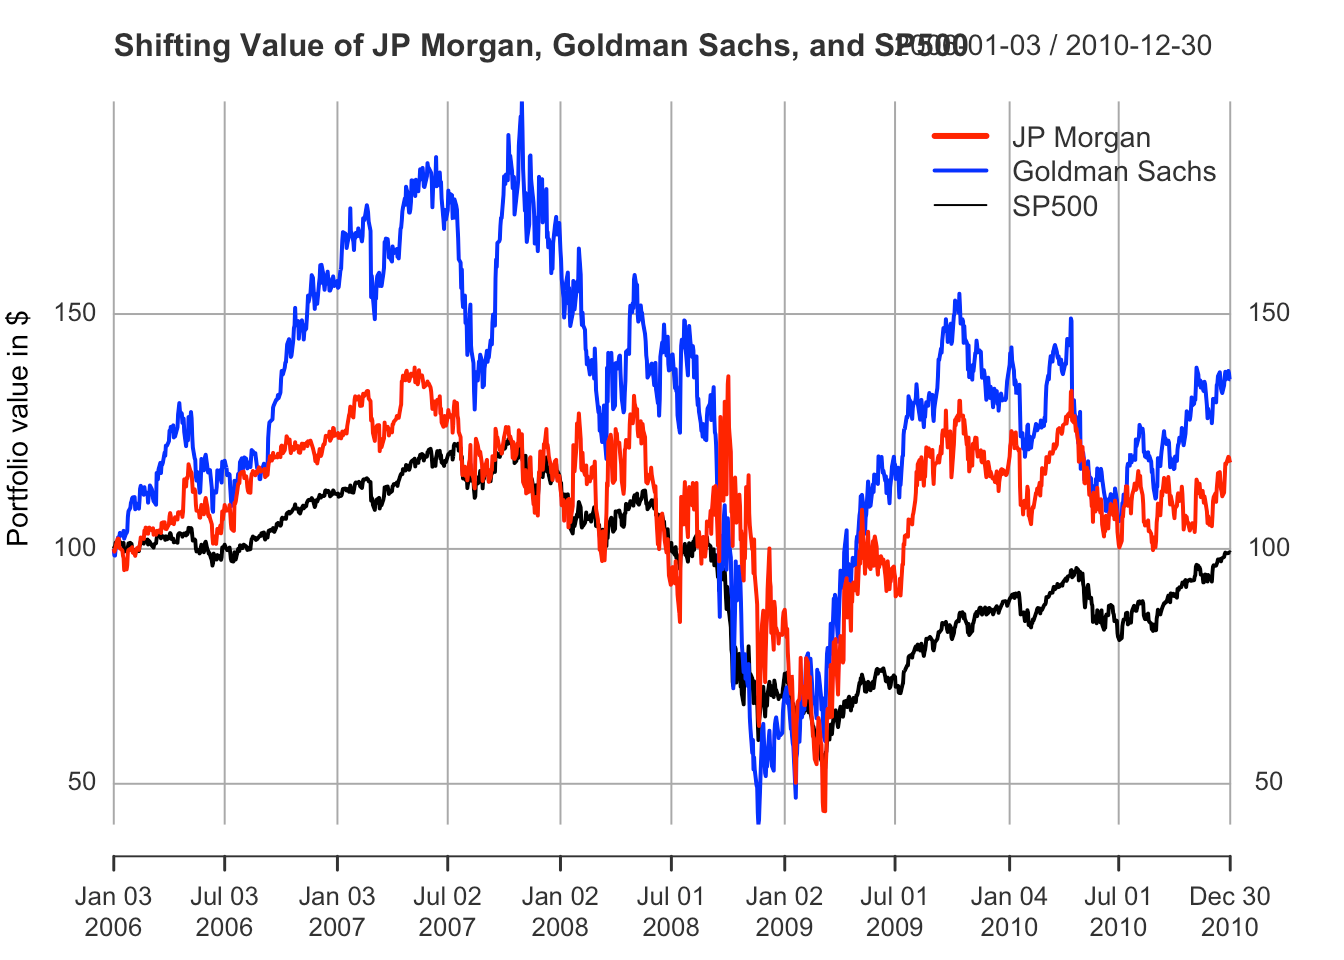
In a calm market a bank has its own story. In a crisis it only has the market's.
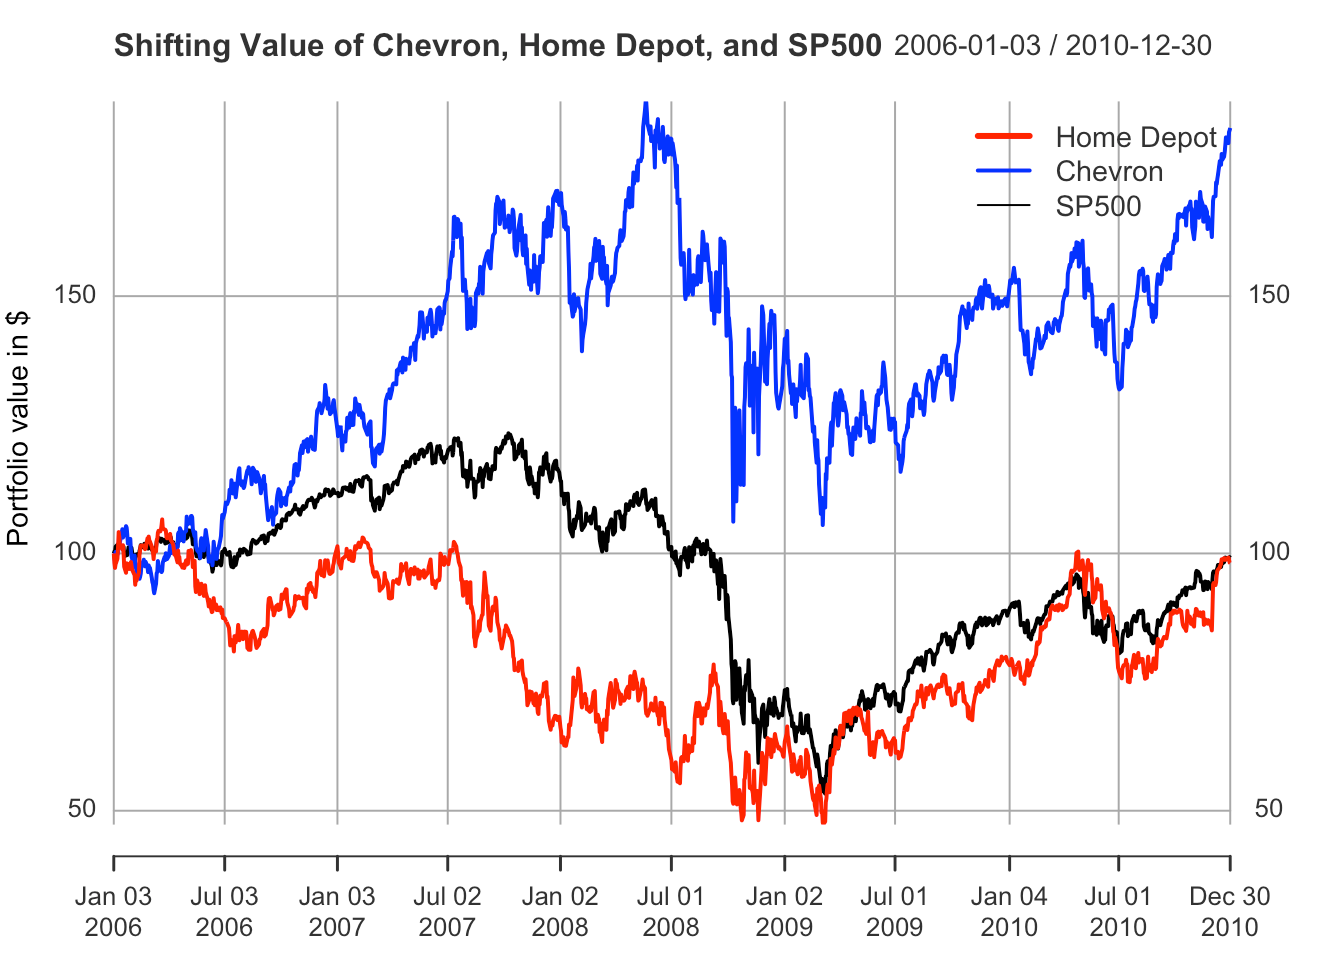
The two large-cap controls barely flinched — Home Depot 1.10 → 1.01 → 0.93, Chevron 0.84 → 1.04 → 0.97. That flatness is what made the bank story legible; without something that didn't move, the moves wouldn't mean anything.
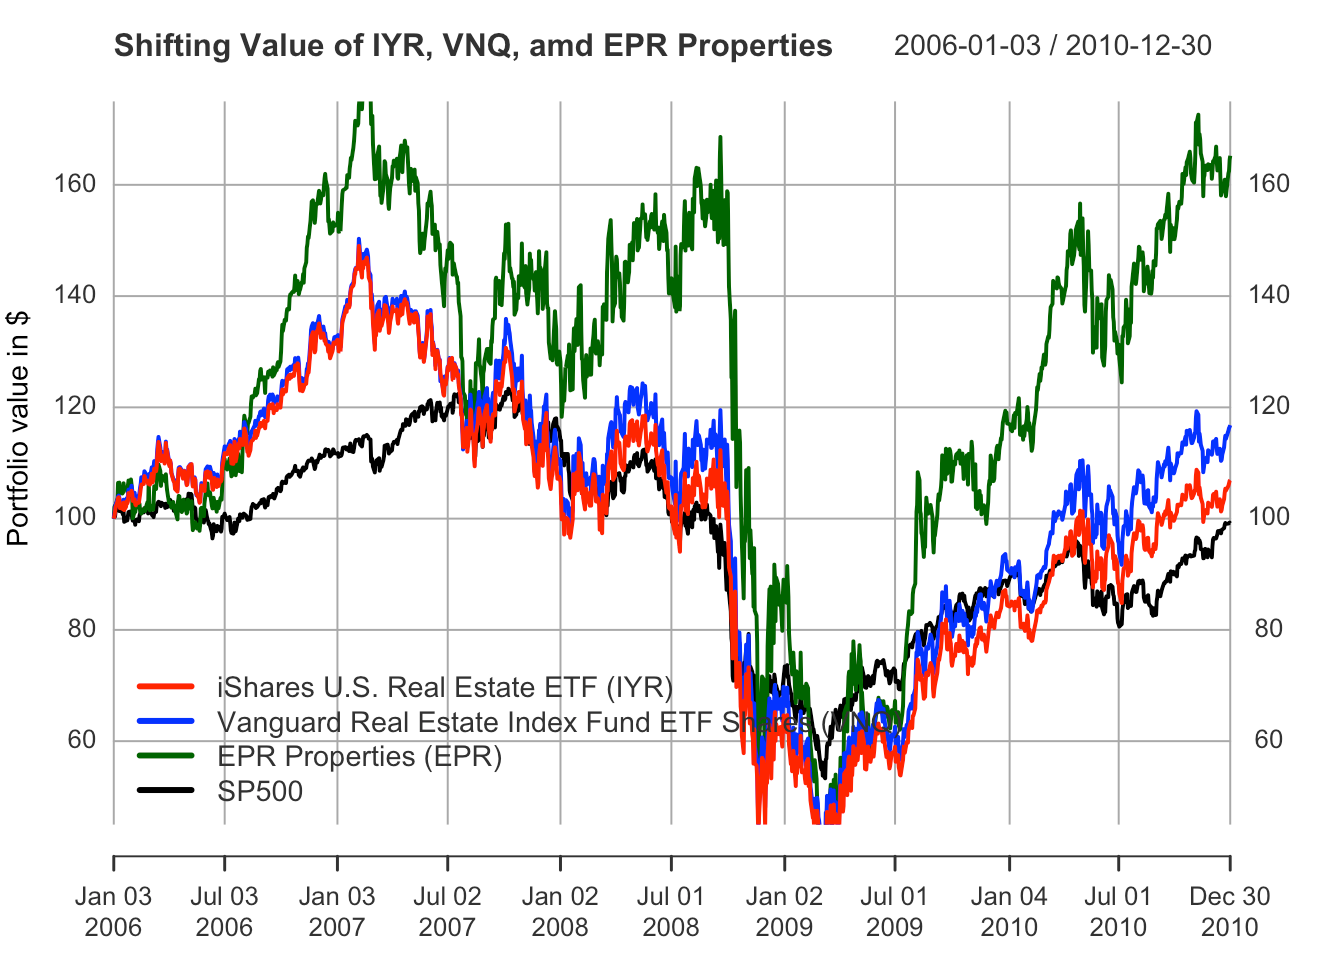
If beta inflates, real estate should inflate hardest.
The part we added ourselves was a hypothesis: if a crisis born in subprime mortgages drives beta up, then the assets sitting closest to the fire — real estate — should show the most extreme inflation of all. So we ran the same three-window regression on a set of REITs.
It held. The real-estate funds (IYR, VNQ, EPR) jumped from roughly 0.95 / 0.87 / 1.14 before the crisis to 1.62 / 1.66 / 1.79 during it — a wider swing than the big banks took. The likeliest reason the banks' blow looks softer in comparison is the obvious one: the banks got a government backstop, and the REITs, levered against collapsing property values, mostly did not. The epicenter moved the most. The model agreed with the geography of the crisis.